If You’re Looking for Trends, It’s Not a Sin to Round Off Numbers
Mind Tricks for Math-Hating Investors
By:April 23, 2021
Ready to Enhance Your Investing Skills?
Get free essential insights to advance your investment journey.
Access the Quickstart PDFThe challenge for beginners is to stick it out long enough for that comfort level to finally kick in. Luckily, there are ways to shorten the learning curve. When numbers start looking like gobbledygook, here are some techniques I use to make numbers more meaningful to me. Some are from the securities analyst playbook, others I’ve picked up through experience.
Turn Ratios Into Percentages
We see percent signs more often than ratios in our daily lives, so when you get stuck on a ratio, flip it upside-down to a percentage. Take the price-earnings ratio. If a stock has earned $1 in the past 12 months and its price is 20, it has a P/E ratio of 20. That means the stock price is 20 times its past earnings. But another way to look at P/E is simply by flipping the ratio upside down to earnings divided by price. If we divide that $1 by the $20 stock price, we get an earnings yield of 5%.That’s a rate of return that might make more sense than a 20:1 P/E ratio. The same holds true of price to book, too. If a price-to book is four, then you can flip it to see that only 25% of the stock price comes from the book value of its assets, which might tell you there better be some cash flow or growth to justify that premium.
‘Common Size’ Those Financial Statements
If you find it tough to compare companies of different sizes, you can extend that percentage approach to turn every number on a balance sheet to percentages of total assets and do the same for income statements by dividing everything on an income statement by sales. Consider the two companies below.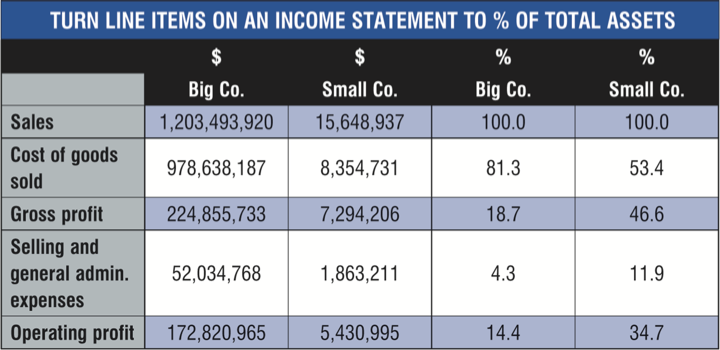
It’s hard to compare the two companies if we just look at raw numbers. But once we turn them into percentages of sales, it’s easy to see that Small Co. has a far more profitable business than Big Co., and we can even see why: Small Co. has much lower costs of goods sold than Big Co.
Guesstimate at First
You don’t need precision when you are just scanning for stock ideas. If you’re looking at trends across quarters or years, round off those big numbers and settle for a rough figure. If the stock looks interesting, then you can always examine it far more closely by completing a Stock Selection Guide.Visualize
While we’re on the SSG, let’s note that one of its great advantages is helping you evaluate the trends of three of any stock’s most important metrics: sales, earnings and stock price. You can easily spot when sales are going up and earnings are flat, or the price has been going up far faster than the trends in profits and sales. Those are red flags that are telling you to do some more research on the company.One of the best tools in your math hater’s kit is being patient with yourself. You aren’t becoming a mathematician; you’re learning a new vocation. In the meantime, you can help manage your math phobia by simply reframing numbers in a way that makes more sense to you.
This article was originally published in the April 2020 issue of BetterInvesting Magazine.
Sam Levine is a frequent contributor to BetterInvesting Magazine. He teaches securities analysis and portfolio management at Wayne State University.