You May Be Paying More Fees Than You Think
What Are Your Portfolio's Hidden Costs?
By:November 16, 2021
Ready to Enhance Your Investing Skills?
Get free essential insights to advance your investment journey.
Access the Quickstart PDFIt’s no secret that fees are a current topic surrounding the investment management industry. Chances are if you’re watching TV, reading a magazine or browsing the internet and you come across an advertisement for a financial services company, low fees are referenced. Consumer access to low-cost investment products is one of the best trends in the industry.
And while it’s helpful to understand the expense of “Fund A” in comparison to “Fund B,” it’s critical for investors to drill down another layer in their portfolio to appreciate the total “all-in cost.”
Low-cost exchange-traded funds are nice, but portfolios can be complex, with added products and investment managers who make the total cost of the portfolio much higher than one would realize. As an example, let’s step back to understand the traditional costs associated with an investor’s portfolio:
Types of Fees
1. Adviser Fee
This is the fee that goes to the financial adviser. The cost here can vary, but for this example it’s 1.0% of assets annually. This should be more transparent and understood by the client/investor, however, if there are commissionable products involved, then all bets are off.
2. Investment management fee
This is an example of a “hidden” layer of fees. If the adviser is not managing the portfolio and is instead outsourcing the investment management to outside individuals or institutions or using investment products, then there will be added expenses. Examples might be separately managed accounts, mutual funds, exchange-traded funds, etc. Expenses can vary even more wildly than advisory fees, ranging from “free” to north of 2.0%.
All the investment management fees for the products in an investor’s portfolio add up to the “total internal expense ratio.” This total internal expense ratio is what is considered to be “the hidden cost of the portfolio” — because investors are generally unaware these costs exist and do not know how to calculate the ratio. If you don't know how to perform this calculation, then this next part will help. Consider this hypothetical portfolio in the graphic at above right, invested in three different mutual funds:
To Calculate the Total Internal Expense Ratio:
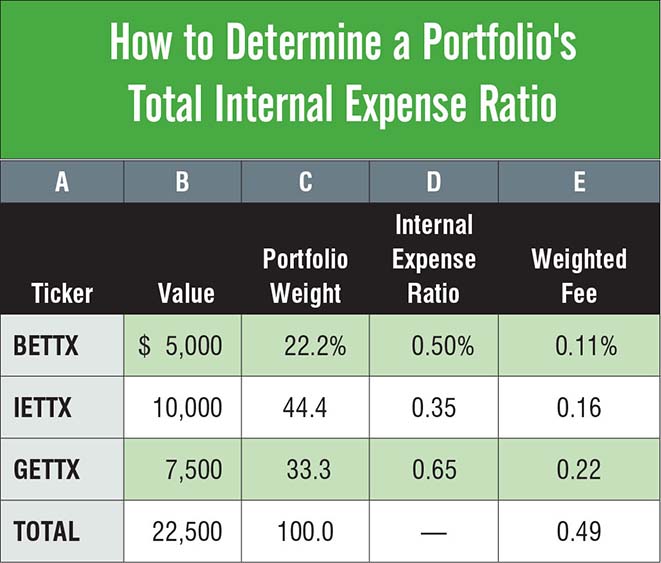
- Calculate the weight that each fund has in the portfolio (Column C). You can get this information from a portfolio snapshot or month-end statement.
- Find the funds’ internal expense ratio — either on the fund company’s website or by doing a ticker search on Yahoo Finance (Column D).
- Multiply Column C and D to calculate the weighted fee of the fund (Column E).
- Sum all the Weighted Fees in Column E to arrive at the portfolio's total internal expense ratio, which in this example is 0.49%.
You Could be in for a Surprise
Now, if you thought you were only paying a financial adviser 1.0% of assets annually, when it’s actually 1.0% in addition to 0.49% in underlying product expense for a total of 1.49% all-in, then you could be in for a surprise. Even if you’re managing your portfolio 401(k) yourself, the same calculation should be performed — you might still surprise yourself.
The point of this isn’t to say all fees or costs are bad, as cost only matters in the absence of value (e.g., why would anyone ever spring for a luxury car versus an economy sedan if lower cost was inherently better?). My goal is to drive home the importance of investors becoming educated consumers and understanding the different layers of fees that may be hiding in plain sight. Continually dive deeper to understand not only what you're paying but what you’re paying for.
This article was originally published in the October 2020 issue of BetterInvesting Magazine.
Matt Mondoux sits on the investment committee and is an adviser at Blue Chip Partners,Inc., a privately owned, registered investment advisory firm based in Farmington Hills, Michigan. Visit www.bluechippartners.com